Overview
Because I am familiar with the Prometheus model, some server software and small applications are usually monitored through Prometheus. So recently I had a new environment that needed to be rebuilt, so I took the opportunity to document the process of installing and configuring prometheus and grafana.
The build involves installing and deploying prometheus and grafana using Docker, mapping the local disk directory (prometheus data can be quite large, so I am using an additional mounted disk), then also including a reverse proxy for Nginx, and a simple configuration of prometheus. service discovery service, provided by replacing the configuration file, because my crawl target is an internal container platform and the target’s ip changes frequently, so I need a simple dynamic change management.
If you just want to learn how to install and deploy Grafana, you can refer to a previous guide I wrote: Installing and deploying Grafana, which covers deploying a systemd-managed of Grafana, as well as steps for using the Nginx proxy.
compose run prometheus & grafana
Install Docker and compose
[root@liqiang.io]# swapoff -a[root@liqiang.io]# yum-config-manager --add-repo https://download.docker.com/linux/centos/docker-ce.repo[root@liqiang.io]# yum install -y docker-ce[root@liqiang.io]# systemctl start docker[root@liqiang.io]# systemctl enable docker[root@liqiang.io]# sudo curl -L "https://github.com/docker/compose/releases/download/1.24.0/docker-compose-$(uname -s)-$(uname -m)" -o /usr/local/sbin/docker-compose[root@liqiang.io]# sudo chmod +x /usr/local/sbin/docker-compose
Environment prepare
[root@liqiang.io]# mkdir -p /data/monitoring/{software,configs,grafana,prometheus}[root@liqiang.io]# mkdir -p /data/monitoring/configs/{grafana,prometheus}[root@liqiang.io]# cd /data/monitoring/software && tar -xvf prometheus-2.42.0.linux-amd64.tar.gz && ln -s prometheus-2.42.0.linux-amd64 prometheus[root@liqiang.io]# cp /data/monitoring/software/prometheus/prometheus.yml /data/monitoring/configs/prometheus/prometheus.yml[root@liqiang.io]# cat > /data/monitoring/configs/grafana/grafana.ini <<EOF[server]protocol = httphttp_addr = 0.0.0.0http_port = 3000domain = grafana.liqiang.ioenforce_domain = trueserve_from_sub_path = trueroot_url = http://%(domain)s:%(http_port)s/grafanaEOF
Run prometheus & grafana
[root@liqiang.io]# cat <<EOF >/data/monitoring/software/docker-compose.yamlversion: "3.7"services:prometheus:image: prom/prometheus:latestuser: "${UID}:${GID}"volumes:- /data/monitoring/configs/prometheus/prometheus.yml:/etc/prometheus/prometheus.yml- /data/monitoring/prometheus:/prometheuscommand:- '--web.enable-lifecycle'- '--config.file=/etc/prometheus/prometheus.yml'- '--storage.tsdb.path=/prometheus'- '--web.console.libraries=/usr/share/prometheus/console_libraries'- '--web.console.templates=/usr/share/prometheus/consoles'ports:- 9090:9090grafana:image: grafana/grafana:latestuser: "${UID}:${GID}"volumes:- /data/monitoring/configs/grafana/grafana.ini:/etc/grafana/grafana.ini- /data/monitoring/grafana:/var/lib/grafanaports:- 3000:3000links:- prometheusEOF[root@liqiang.io]# cd /data/monitoring/software/ && docker-compose up -d
At this point, both Prometheus and Grafana have been installed and deployed, and you can access Grafana via http://localhost:3000. However, I used to use Nginx as a proxy so that I didn’t have to specify an additional port.
Configuring Nginx
Since I already have Nginx installed, I don’t need to install it again. If you don’t have it installed, the easy option is to run another Nginx with docker-compose, or install one directly with Linux’s package management software, for example, I installed it directly with Yum by
[root@liqiang.io]# yum install -y nginx[root@liqiang.io]# mkdir -p /etc/nginx/grafana[root@liqiang.io]# cat> /etc/nginx/grafana/grafana.conf << EOFlocation /grafana {proxy_pass http://127.0.0.1:3000;proxy_set_header X-Real-IP $remote_addr;proxy_set_header Host $host;proxy_set_header X-Forwarded-For $proxy_add_x_forwarded_for;proxy_http_version 1.1;proxy_set_header Upgrade $http_upgrade;proxy_set_header Connection "upgrade";proxy_redirect off;}EOF[root@liqiang.io]# echo "Please add 'include /etc/nginx/grafana/*.conf;' to your nginx.conf"[root@liqiang.io]# nginx -t[root@liqiang.io]# nginx -s reload
Configurare Grafana
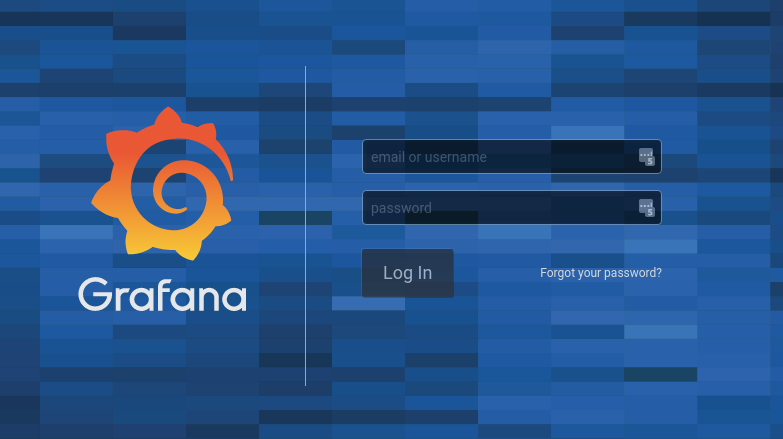
Open the browser and use this URL:http://grafana.liqiang.io/grafana,I think you can see this page:
| Figure 1:Grafana Login Page |
|---|

|
The default username and password for grafana is:
- Username:admin
- Password:admin
You will then be asked to change your password, it is best to do so.
Service discovery procedures
Prometheus supports a very wide range of service discovery methods, for example:
- kubernetes_sd_config
- docker_sd_config
- openstack_sd_config
However, these service discovery features are that the URL Path of the Target you need to collect is fixed and can only be a list of service discovery Endpoints, meaning that you can only use the number of Containers for a specific service discovery and cannot dynamically increase or decrease the type of service.
For example, if you have two services, Order and Account, then Prometheus’ service discovery supports you to dynamically change the number of containers for these two services, for example from 100 to 150. However, if you add a new service, Item, then this service discovery provided by Prometheus is not supported.
So what do we do to dynamically scale the service, here I have chosen to write a program that then dynamically does the service metadata work and then, depending on the actual situation (e.g. the deployment platform of the service), extend this program to do the dynamic discovery of the Endpoint:.
- Service metadata discovery: this is achieved by replacing the main Prometheus configuration file and having Prometheus reload the configuration.
- Endpiont service discovery: this is implemented through the service discovery interface that comes with Prometheus, as the platform I am using does not support all of these API service discoveries, so I chose to implement it in the form of filesd.
Service Metadata Discovery
There are two key points in the implementation of service metadata discovery.
- Getting the service metadata: this step is related to the deployment platform, so it varies from person to person
- Constructing the configuration of Prometheus: this step is fixed and can be rendered through the configuration template once we have determined the service metadata
Since the code is quite long, I won’t post it, but if you are interested you can just open the Github Repo: devops/prometheus/service_discovery to see for yourself~, and in practice, add a service to the end of docker-compose.yaml:
[root@liqiang.io]# cat docker-compose.yaml... ...service-discovery:image: liqiangliu/prometheus-service-discovery:0.3.0user: "${UID}:${GID}"environment:- PROMETHEUS_ADDR=http://prometheus:9090volumes:- /data/monitoring/configs/prometheus:/etc/prometheusports:- 5555:5555
Then try to add a service:
[root@liqiang.io]# curl --location --request POST 'http://127.0.0.1:5555/services' --header 'Content-Type: application/json' --data-raw '{"name": "prometheus-default","endpoints": [{"host": "prometheus","port": 9090}]}'
Summary
This completes our docker compose based prometheus and grafana monitoring system, and supports a simple service discovery feature, which is simple to apply, so you can extend it yourself.